1. Zabbix监控Nginx
1. 实验环境
角色                 IP                  服  务
Zabbix-Server     172.16.1.71     Zabbix-Server
Zabbix-Agent     172.16.1.7     Nginx
2. 配置Nginx
[root@nginx ~]# cat /etc/yum.repos.d/nginx.repo
[nginx]
name=nginx repo
baseurl=http://nginx.org/packages/centos/7/$basearch/
gpgcheck=0
enabled=1
[root@web01 ~]# yum install -y nginx

#编辑配置文件
[root@web01 ~]# cat /etc/nginx/conf.d/default.conf
server {
listen 80;
server_name localhost;
location / {
root /usr/share/nginx/html;
index index.html index.htm;
}
location /nginx_status {
     stub_status on;
    access_log off;
    allow 127.0.0.1;
    deny all;
}
}

[root@web01 ~]# systemctl start nginx
3. 本地访问Nginx Status
[root@web01 ~]# curl http://127.0.0.1/nginx_status
Active connections: 1
server accepts handled requests
1 1 1
Reading: 0 Writing: 1 Waiting: 0
4. 编写Nginx的Shell脚本(如果端口不一致,只需要修改脚本端口即可)
[root@web01 ~]# mkdir -p /etc/zabbix/scripts
[root@web01 ~]# cat /etc/zabbix/scripts/nginx_status.sh
#!/bin/bash
NGINX_PORT=80 #如果端口不同仅需要修改脚本即可,否则修改xml很麻烦
NGINX_COMMAND=$1
nginx_active(){
/usr/bin/curl -s "http://127.0.0.1:"$NGINX_PORT"/nginx_status/" |awk '/Active/ {print $NF}'
}
nginx_reading(){
/usr/bin/curl -s "http://127.0.0.1:"$NGINX_PORT"/nginx_status/" |awk '/Reading/ {print $2}'
}
nginx_writing(){
/usr/bin/curl -s "http://127.0.0.1:"$NGINX_PORT"/nginx_status/" |awk '/Writing/ {print $4}'
}
nginx_waiting(){
/usr/bin/curl -s "http://127.0.0.1:"$NGINX_PORT"/nginx_status/" |awk '/Waiting/ {print $6}'
}
nginx_accepts(){
/usr/bin/curl -s "http://127.0.0.1:"$NGINX_PORT"/nginx_status/" |awk 'NR==3 {print $1}'
}
nginx_handled(){
/usr/bin/curl -s "http://127.0.0.1:"$NGINX_PORT"/nginx_status/" |awk 'NR==3 {print $2}'
}
nginx_requests(){
/usr/bin/curl -s "http://127.0.0.1:"$NGINX_PORT"/nginx_status/" |awk 'NR==3 {print $3}'
}
case $NGINX_COMMAND in
active)
nginx_active;
;;
reading)
nginx_reading;
;;
writing)
nginx_writing;
;;
waiting)
nginx_waiting;
;;
accepts)
nginx_accepts;
;;
handled)
nginx_handled;
;;
requests)
nginx_requests;
;;
*)
echo $"USAGE:$0 {active|reading|writing|waiting|accepts|handled|requests}"
esac

####################################################################################################
Active connections # 当前活动客户端连接数,包括Waiting等待连接数。
accepts # 已接受总的TCP连接数。
handled # 已处理总的TCP连接数。
requests # 客户端总的http请求数。
Reading # 当前nginx读取请求头的连接数。
Writing # 当前nginx将响应写回客户端的连接数。
Waiting # 当前等待请求的空闲客户端连接数

#给脚本添加执行权限
6. 监控项nginx_status.conf的配置文件如下:
[root@web01 ~]# cat /etc/zabbix/zabbix_agentd.d/nginx_status.conf
UserParameter=nginx_status[*],/bin/bash /etc/zabbix/scripts/nginx_status.sh "$1"
7. 重启zabbix-agent
[root@web01 ~]# systemctl restart zabbix-agent
8. 使用Zabbix_get来获取值
[root@zabbixserver ~]# zabbix_get -s 172.16.1.7 -k nginx_status[writing]
1
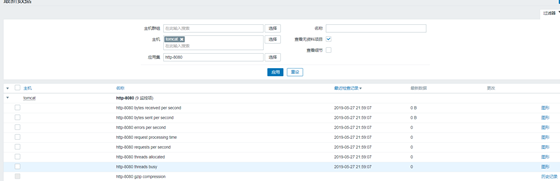
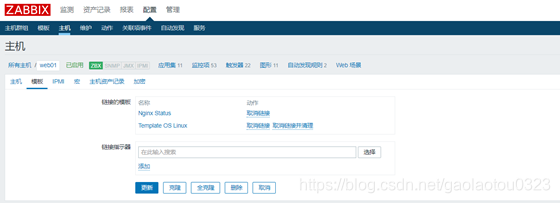
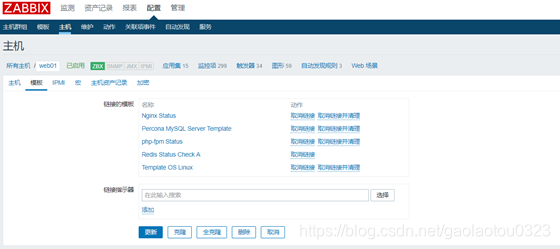
9. 添加所有监控项, 记得关联到指定的主机


2. Zabbix监控PHP
1. 实验环境
角色                 IP                  服务
Zabbix-Server     172.16.1.71     Zabbix-Server
Zabbix-Agent     172.16.1.7     Nginx+PHP
2. 部署配置PHP-FPM
[root@web01 ~]# yum remove php-mysql-5.4 php php-fpm php-common -y
[root@web01 ~]# cat /etc/yum.repos.d/php.repo
[php]
name = php Repository
baseurl = http://us-east.repo.webtatic.com/yum/el7/x86_64/
gpgcheck = 0

[root@web01 ~]# yum -y install php71w php71w-cli php71w-common php71w-devel php71w-embedded php71w-gd php71w-mcrypt php71w-mbstring php71w-pdo php71w-xml php71w-fpm php71w-mysqlnd php71w-opcache php71w-pecl-memcached php71w-pecl-redis php71w-pecl-mongodb

[root@web01 ~]# vim /etc/php-fpm.d/www.conf
pm.status_path = /phpfpm_status
3. 修改nginx.conf的配置文件,增加如下location访问PHP-FPM状态信息。
location ~ ^/(phpfpm_status)$ {
include fastcgi_params;
fastcgi_pass 127.0.0.1:9000;
fastcgi_param SCRIPT_FILENAME $document_root$fastcgi_script_name;
}
[root@web01 ~]# systemctl restart nginx.service
[root@web01 ~]# systemctl start php-fpm.service
4. 访问测试phpfpm_status
[root@web01 ~]# curl http://127.0.0.1/phpfpm_status
pool: www
process manager: dynamic
start time: 27/May/2019:12:32:42 +0800
start since: 30
accepted conn: 1
listen queue: 0
max listen queue: 0
listen queue len: 128
idle processes: 4
active processes: 1
total processes: 5
max active processes: 1
max children reached: 0
slow requests: 0

#PHP-FPM状态解释:
pool                 #fpm池名称,大多数为www
process manager      #进程管理方式dynamic或者static
start time             #启动日志,如果reload了fpm,时间会更新
start since          #运行时间,秒级
accepted conn          #当前池接受的请求数
listen queue          #请求等待队列,如果这个值不为0,那么需要增加FPM的进程数量
max listen queue      #请求等待队列最高的数量
listen queue len      #socket等待队列长度
idle processes          #空闲进程数量
active processes      #活跃进程数量
total processes         #总进程数量
max active processes #最大的活跃进程数量(FPM启动开始计算)
max children reached #进程最大数量限制的次数,如果这个数量不为0,那说明你的最大进程数量过小,可以适当调整。
slow requests         #慢请求的次数,一般假设这个值未非0,那么可能会有慢的php进程,一般一个不好的mysql查询是最大的祸首。
5. 编写php-fpm的Shell脚本(如果端口不一致,只需要修改脚本端口即可)
[root@web01 ~]# cd /etc/zabbix/scripts
[root@web01 scripts]# cat phpfpm_status.sh
#!/bin/bash
PHPFPM_COMMAND=$1
PHPFPM_PORT=80 #根据监听不同端口进行调整
start_since(){
/usr/bin/curl -s "http://127.0.0.1:"$PHPFPM_PORT"/phpfpm_status" |awk '/^start since:/ {print $NF}'
}
accepted_conn(){
/usr/bin/curl -s "http://127.0.0.1:"$PHPFPM_PORT"/phpfpm_status" |awk '/^accepted conn:/ {print $NF}'
}
listen_queue(){
/usr/bin/curl -s "http://127.0.0.1:"$PHPFPM_PORT"/phpfpm_status" |awk '/^listen queue:/ {print $NF}'
}
max_listen_queue(){
/usr/bin/curl -s "http://127.0.0.1:"$PHPFPM_PORT"/phpfpm_status" |awk '/^max listen queue:/ {print $NF}'
}
listen_queue_len(){
/usr/bin/curl -s "http://127.0.0.1:"$PHPFPM_PORT"/phpfpm_status" |awk '/^listen queue len:/ {print $NF}'
}
idle_processes(){
/usr/bin/curl -s "http://127.0.0.1:"$PHPFPM_PORT"/phpfpm_status" |awk '/^idle processes:/ {print $NF}'
}
active_processes(){
/usr/bin/curl -s "http://127.0.0.1:"$PHPFPM_PORT"/phpfpm_status" |awk '/^active processes:/ {print $NF}'
}
total_processes(){
/usr/bin/curl -s "http://127.0.0.1:"$PHPFPM_PORT"/phpfpm_status" |awk '/^total processes:/ {print $NF}'
}
max_active_processes(){
/usr/bin/curl -s "http://127.0.0.1:"$PHPFPM_PORT"/phpfpm_status" |awk '/^max active processes:/ {print $NF}'
}
max_children_reached(){
/usr/bin/curl -s "http://127.0.0.1:"$PHPFPM_PORT"/phpfpm_status" |awk '/^max children reached:/ {print $NF}'
}
slow_requests(){
/usr/bin/curl -s "http://127.0.0.1:"$PHPFPM_PORT"/phpfpm_status" |awk '/^slow requests:/ {print $NF}'
}
case $PHPFPM_COMMAND in
start_since)
start_since;
;;
accepted_conn)
accepted_conn;
;;
listen_queue)
listen_queue;
;;
max_listen_queue)
max_listen_queue;
;;
listen_queue_len)
listen_queue_len;
;;
idle_processes)
idle_processes;
;;
active_processes)
active_processes;
;;
total_processes)
total_processes;
;;
max_active_processes)
max_active_processes;
;;
max_children_reached)
max_children_reached;
;;
slow_requests)
slow_requests;
;;
*)
echo $"USAGE:$0 {start_since|accepted_conn|listen_queue|max_listen_queue|listen_queue_len|idle_processes|active_processes|total_processes|max_active_processes|max_children_reached}"
esac

#### 给脚本添加执行权限
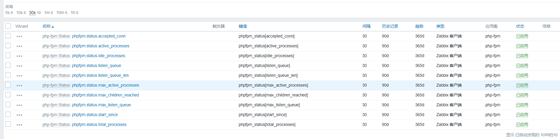
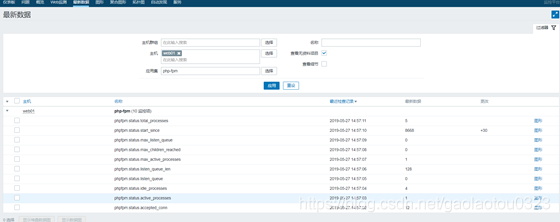
7. 监控项的phpfpm_status.conf配置文件如下:
[root@web01 scripts]# cat /etc/zabbix/zabbix_agentd.d/phpfpm_status.conf
UserParameter=phpfpm_status[*],/bin/bash /etc/zabbix/scripts/phpfpm_status.sh "$1"
8. 重启zabbix-agent
[root@web01 scripts]# systemctl restart zabbix-agent.service
9. Server使用zabbix_get命令来获取Agent端的值
[root@zabbixserver ~]# zabbix_get -s 172.16.1.7 -k phpfpm_status[accepted_conn]
2
10. 添加所有监控项, 最后记得关联至对应主机


3. Zabbix监控MySQL
percona Monitoring Plugins 是一个高质量的组件,为MySQL数据库添加企业级的监控和图表功能。但其脚本使用 PHP实现,故而Zabbix-Agent需要安装PHP环境
1. 实验环境
角色                   I  P            服务
Zabbix-Server     172.16.1.71     Zabbix-Server
Zabbix-Agent     172.16.1.7     Nginx+PHP+MySQL
2. 在Zabbix-Agent端安装percona Monitoring Plugins
[root@web01 scripts]# yum install -y http://www.percona.com/downloads/percona-release/redhat/0.1-3/percona-release-0.1-3.noarch.rpm
[root@web01 scripts]# yum install percona-zabbix-templates -y
3. 查看percona安装后的目录结构
[root@web01 scripts]# tree /var/lib/zabbix/percona/
/var/lib/zabbix/percona/
├── scripts
│   ├── get_mysql_stats_wrapper.sh
│   └── ss_get_mysql_stats.php
└── templates
├── userparameter_percona_mysql.conf
└── zabbix_agent_template_percona_mysql_server_ht_2.0.9-sver1.1.8.xml
2 directories, 4 files
4. 将自定义监控项配置文件复制至/etc/zabbix_agentd.conf.d目录下
[root@web01 scripts]# cp /var/lib/zabbix/percona/templates/userparameter_percona_mysql.conf /etc/zabbix/zabbix_agentd.d/percona_mysql.conf
5. 重启zabbix-agent
[root@web01 scripts]# systemctl restart zabbix-agent.service
6. 修改脚本中的MySQL用户名和密码
[root@web01 scripts]# vim /var/lib/zabbix/percona/scripts/ss_get_mysql_stats.php
$mysql_user = 'zabbix';
$mysql_pass = 'qls123.com';
$mysql_port = 3306;
7. 在Zabbix-Server端上使用Zabbix_get获取值(否则会失败)
[root@zabbixserver ~]# zabbix_get -s 172.16.1.7 -k MySQL.pool-read-requests
239816
#如果获取不到值常见问题
1.看是否是MySQL密码错
2.不要直接执行脚本来获
3.删除/tmp/localhost-mysql_cacti_stats.txt文件
4.权限问题导致
8. 在Zabbix页面模板选项中导入Percona模板, 模板存放在/var/lib/zabbix/percona/templates, 最后关联主机即可。
导入模板时会出现:标签无效 "/zabbix_export/date": "YYYY-MM-DDThh:mm:ssZ" 预计的错误。
解决办法:
将zabbix_agent_template_percona_mysql_server_ht_2.0.9-sver1.1.8.xml导入zabbix2.4中再导出。之后将新的导出xml导入到3.2中问题解决。


4. Zabbix监控Redis
Redis使用自带的INFO命令,进行状态监控。以一种易于解释且易于阅读的格式,返回关于Redis服务器的各种信息和统计数值。
1. 实验环境
角色                 IP                服务
Zabbix-Server     172.16.1.71     Zabbix-Server
Zabbix-Agent     172.16.1.7     Redis
2. 下载Redis
[root@web01 ~]# yum install -y redis
[root@web01 ~]# systemctl start redis.service
3. 编写Shell脚本
脚本端口、连接redis服务地址根据具体情况进行修改
AUTH认证没有开启,将PASSWD修改为空即可。

[root@web01 ~]# cat /etc/zabbix/scripts/redis_status.sh
#!/bin/bash
R_COMMAND="$1"
R_PORT="6379" #根据实际情况调整端口
R_SERVER="127.0.0.1" #根据具体情况调整IP地址
PASSWD="" #如果没有设置Redis密码,为空即可
redis_status(){
(echo -en "AUTH $PASSWD\r\nINFO\r\n";sleep 1;) | /usr/bin/nc "$R_SERVER" "$R_PORT" > /tmp/redis_"$R_PORT".tmp
REDIS_STAT_VALUE=$(grep "$R_COMMAND:" /tmp/redis_"$R_PORT".tmp | cut -d ':' -f2)
echo "$REDIS_STAT_VALUE"
}
case $R_COMMAND in
used_cpu_user_children)
redis_status "$R_PORT" "$R_COMMAND"
;;
used_cpu_sys)
redis_status "$R_PORT" "$R_COMMAND"
;;
total_commands_processed)
redis_status "$R_PORT" "$R_COMMAND"
;;
role)
redis_status "$R_PORT" "$R_COMMAND"
;;
lru_clock)
redis_status "$R_PORT" "$R_COMMAND"
;;
latest_fork_usec)
redis_status "$R_PORT" "$R_COMMAND"
;;
keyspace_misses)
redis_status "$R_PORT" "$R_COMMAND"
;;
keyspace_hits)
redis_status "$R_PORT" "$R_COMMAND"
;;
keys)
redis_status "$R_PORT" "$R_COMMAND"
;;
expired_keys)
redis_status "$R_PORT" "$R_COMMAND"
;;
evicted_keys)
redis_status "$R_PORT" "$R_COMMAND"
;;
connected_clients)
redis_status "$R_PORT" "$R_COMMAND"
;;
changes_since_last_save)
redis_status "$R_PORT" "$R_COMMAND"
;;
blocked_clients)
redis_status "$R_PORT" "$R_COMMAND"
;;
rdb_bgsave_in_progress)
redis_status "$R_PORT" "$R_COMMAND"
;;
aof_rewrite_in_progress)
redis_status "$R_PORT" "$R_COMMAND"
;;
used_memory_peak)
redis_status "$R_PORT" "$R_COMMAND"
;;
used_memory)
redis_status "$R_PORT" "$R_COMMAND"
;;
used_cpu_user)
redis_status "$R_PORT" "$R_COMMAND"
;;
used_cpu_sys_children)
redis_status "$R_PORT" "$R_COMMAND"
;;
total_connections_received)
redis_status "$R_PORT" "$R_COMMAND"
;;
cluster_enabled)
redis_status "$R_PORT" "$R_COMMAND"
    ;;
*)
    echo $"USAGE:$0 {used_cpu_user_children|used_cpu_sys|total_commands_processed|role|lru_clock|latest_fork_usec|keyspace_misses|keyspace_hits|keys|expired|expired_keys|connected_clients|changes_since_last_save|blocked_clients|rdb_bgsave_in_progress|used_memory_peak|used_memory|used_cpu_user|used_cpu_sys_children|total_connections_received|aof_rewrite_in_progress|cluster_enabled}"
esac
4. Redis状态参数解释
[root@web01 ~]# redis-cli info
server : Redis         服务器信息,包含以下域:
redis_version : Redis     服务器版本
redis_git_sha1 : Git SHA1
redis_git_dirty : Git dirty flag
os : Redis     服务器的宿主操作系统
arch_bits : 架构(32 或 64 位)
multiplexing_api : Redis 所使用的事件处理机制
gcc_version : 编译 Redis 时所使用的 GCC 版本
process_id : 服务器进程的 PID
run_id : Redis 服务器的随机标识符(用于 Sentinel 和集群)
tcp_port : TCP/IP 监听端口
uptime_in_seconds : 自 Redis 服务器启动以来,经过的秒数
uptime_in_days : 自 Redis 服务器启动以来,经过的天数
lru_clock : 以分钟为单位进行自增的时钟,用于 LRU 管理
clients : 已连接客户端信息,包含以下域:
connected_clients : 已连接客户端的数量(不包括通过从属服务器连接的客户端)
client_longest_output_list : 当前连接的客户端当中,最长的输出列表
client_longest_input_buf : 当前连接的客户端当中,最大输入缓存
blocked_clients : 正在等待阻塞命令(BLPOP、BRPOP、BRPOPLPUSH)的客户端的数量
memory : 内存信息,包含以下域:
used_memory : 由 Redis 分配器分配的内存总量,以字节(byte)为单位
used_memory_human : 以人类可读的格式返回 Redis 分配的内存总量
used_memory_rss : 从操作系统的角度,返回 Redis 已分配的内存总量(俗称常驻集大小)。这个值和 top 、 ps 等命令的输出一致。
used_memory_peak : Redis 的内存消耗峰值(以字节为单位)
used_memory_peak_human : 以人类可读的格式返回 Redis 的内存消耗峰值
used_memory_lua : Lua 引擎所使用的内存大小(以字节为单位)
mem_fragmentation_ratio : used_memory_rss 和 used_memory 之间的比率
persistence : RDB 和 AOF 的相关信息
stats : 一般统计信息
replication : 主/从复制信息
cpu : CPU 计算量统计信息
commandstats : Redis 命令统计信息
cluster : Redis 集群信息
keyspace : 数据库相关的统计信息
参数还可以是下面这两个:
all : 返回所有信息
default : 返回默认选择的信息
#当不带参数直接调用 INFO 命令时,使用 default 作为默认参数。
5. 添加脚本执行权限
[root@web01 ~]# chmod +x /etc/zabbix/scripts/redis_status.sh
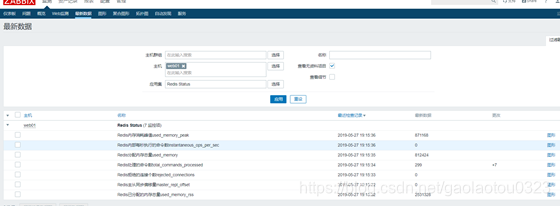
6. key的redis_status.conf的配置文件如下:
[root@web01 ~]# cat /etc/zabbix/zabbix_agentd.d/redis_status.conf
UserParameter=redis.status[*],/bin/bash /etc/zabbix/scripts/redis_status.sh "$1"
7. 重启zabbix-agent
[root@web01 ~]# systemctl restart zabbix-agent
8. 在Zabbix-Server使用Zabbix_get获取值
[root@zabbixserver ~]# zabbix_get -s 172.16.1.7 -k redis.status[used_memory]
813480

#Zabbix权限不足处理办法
[root@web01 ~]# rm -f /tmp/redis_status.log
9. 在Zabbix页面模板选项中导入模板, 最后关联主机即可。
5. Zabbix监控Jvm
在Zabbix中,JMX监控数据的获取由专门的代理程序来实现,即Zabbix-Java-Gateway来负责数据的采集,Zabbix-Java-Gateway和JMX的Java程序之间通信获取数据

JMX在Zabbix中的运行流程:
1.Zabbix-Server找Zabbix-Java-Gateway获取Java数据
2.Zabbix-Java-Gateway找Java程序(zabbix-agent)获取数
3.Java程序返回数据给Zabbix-Java-Gateway
4.Zabbix-Java-Gateway返回数据给Zabbix-Server
5.Zabbix-Server进行数据展示
1. 实验环境
角色                       IP             服务
Zabbix-Server     172.16.1.71     Zabbix-Server+zabbixjavagateway
Zabbix-Agent     172.16.1.7     Tomcat
2. 环境部署
#部署java环境,在一台新的主机上面部署
[root@lb-4 ~]# mkdir -p /application/tools/

#上传两个软件压缩包到/application/tools/下面
[root@tomcat /application/tools]# ll
total 372260
-rw-r--r-- 1 root root 9128610 2015-10-05 10:58 apache-tomcat-8.0.27.tar.gz
-rw-r--r-- 1 root root 170023183 2018-08-14 11:05 jdk-8u181-linux-x64.rpm
-rw-r--r-- 1 root root 20797013 2017-03-03 11:24 jpress-web-newest.war


#安装jdk
root@tomcat /application/tools]# rpm -ivh jdk-8u181-linux-x64.rpm
warning: jdk-8u181-linux-x64.rpm: Header V3 RSA/SHA256 Signature, key ID ec551f03: NOKEY
Preparing... ################################# [100%]
Updating / installing...
1:jdk1.8-2000:1.8.0_181-fcs ################################# [100%]
Unpacking JAR files...
    tools.jar...
    plugin.jar...
    javaws.jar...
    deploy.jar...
    rt.jar...
    jsse.jar...
    charsets.jar...
    localedata.jar...


#将Tomcat的解压到/application目录下
[root@tomcat /application/tools]# tar xf apache-tomcat-8.0.27.tar.gz -C /application/

#创建软连接
[root@tomcat /application/tools]# ln -s /application/apache-tomcat-8.0.27/ /application/tomcat

#设置环境变量
[root@tomcat /application/tools]# echo 'export TOMCAT_HOME=/application/tomcat'>>/etc/profile
[root@tomcat /application/tools]# source /etc/profile

#启动Tomcat
[root@lb-4 ~]# /application/tomcat/bin/startup.sh
Using CATALINA_BASE: /application/tomcat
Using CATALINA_HOME: /application/tomcat
Using CATALINA_TMPDIR: /application/tomcat/temp
Using JRE_HOME: /application/jdk
Using CLASSPATH: /application/tomcat/bin/bootstrap.jar:/application/tomcat/bin/tomcat-juli.jar
Tomcat started.


#web界面进行访问测试

#上传软件jpress到系统中,此软件上传后会自动解压
[root@tomcat /application/tools]# mv jpress-web-newest.war /application/tomcat/webapps/

#进入数据库,创建库及用户名
[root@db01 ~]# mysql -uroot -pqls123.com
Welcome to the MariaDB monitor. Commands end with ; or \g.
Your MariaDB connection id is 5332
Server version: 5.5.60-MariaDB MariaDB Server
Copyright (c) 2000, 2018, Oracle, MariaDB Corporation Ab and others.
Type 'help;' or '\h' for help. Type '\c' to clear the current input statement.
MariaDB [(none)]> create database jpress;
Query OK, 1 row affected (0.00 sec)
MariaDB [(none)]> grant all on jpress.* to jpress@'10.0.0.%' identified by '123456';
Query OK, 0 rows affected (0.01 sec)
MariaDB [(none)]> Bye

#web浏览器上面进行安装jpress,输入 10.0.0.12:8080/jpress-web-newest/,安装完成根据提示重启Tomcat

#登录后台界面
http://10.0.0.12:8080/jpress-web-newest/admin/login
3. 开启tomcat的远程jvm配置文件
[root@tomcat ~]# vim /application/tomcat/bin/catalina.sh
CATALINA_OPTS="$CATALINA_OPTS
-Dcom.sun.management.jmxremote
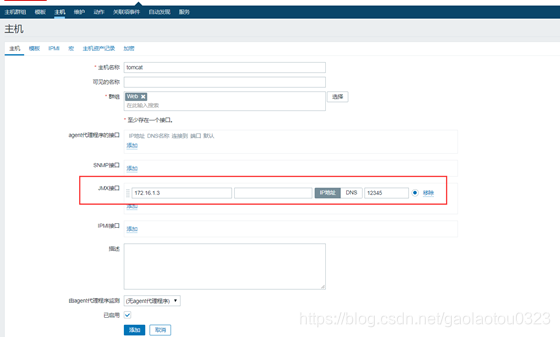
-Djava.rmi.server.hostname=10.0.0.12
-Dcom.sun.management.jmxremote.port=12345
-Dcom.sun.management.jmxremote.ssl=false
-Dcom.sun.management.jmxremote.authenticate=false"
#jvm配置文件解释
CATALINA_OPTS="$CATALINA_OPTS
#启用远程监控JMX
-Dcom.sun.management.jmxremote
#运行tomcat主机的IP地址
-Djava.rmi.server.hostname=10.0.0.12
#jmx启用远程端口,Zabbix添加时必须一致
-Dcom.sun.management.jmxremote.port=12345
#不开启用户密码认证
-Dcom.sun.management.jmxremote.authenticate=false
#不启用ssl加密传输
-Dcom.sun.management.jmxremote.ssl=false
4. 进行本地hosts解析
[root@tomcat ~]# cat /etc/hosts
127.0.0.1 localhost localhost.localdomain localhost4 localhost4.localdomain4
::1 localhost localhost.localdomain localhost6 localhost6.localdomain6
172.16.1.12 tomcat
5. 重启tomcat服务
[root@tomcat ~]# /application/tomcat/bin/shutdown.sh
Using CATALINA_BASE: /application/tomcat
Using CATALINA_HOME: /application/tomcat
Using CATALINA_TMPDIR: /application/tomcat/temp
Using JRE_HOME: /application/jdk
Using CLASSPATH: /application/tomcat/bin/bootstrap.jar:/application/tomcat/bin/tomcat-juli.jar

[root@tomcat ~]# /application/tomcat/bin/startup.sh
Using CATALINA_BASE: /application/tomcat
Using CATALINA_HOME: /application/tomcat
Using CATALINA_TMPDIR: /application/tomcat/temp
Using JRE_HOME: /application/jdk
Using CLASSPATH: /application/tomcat/bin/bootstrap.jar:/application/tomcat/bin/tomcat-juli.jar
Tomcat started.
6. 在zabbixserver端安装zabbix-java-gateway
[root@zabbixserver ~]# yum install zabbix-java-gateway -y
#配置zabbix-java-gateway
[root@zabbixserver ~]# grep -Ev '^$|#' /etc/zabbix/zabbix_java_gateway.conf
LISTEN_IP="0.0.0.0"
LISTEN_PORT=10052
PID_FILE="/var/run/zabbix/zabbix_java.pid"
START_POLLERS=5
TIMEOUT=10
#启动
[root@zabbixserver ~]# systemctl start zabbix-java-gateway

#设置为开机自启动
[root@zabbixserver ~]# systemctl enable zabbix-java-gateway

#修改zabbix-server配置文件
[root@zabbixserver ~]# grep -Ev '^$|#' /etc/zabbix/zabbix_server.conf

#java gateway地址
JavaGateway=127.0.0.1

#java gateway默认端口10052
JavaGatewayPort=10052

#启动进程轮询java gateway
StartJavaPollers=5

#重启zabbix-server
[root@zabbixserver ~]# systemctl restart zabbix-server

#重启之后客户端Tomcat的12345端口是否启动
[root@tomcat ~]# netstat -lntp|grep 12345
tcp6 0 0 :::12345 :::* LISTEN 2542/java
7. 添加zabbix-agent端
[root@tomcat ~]# rpm -ivh http://repo.zabbix.com/zabbix/4.0/rhel/7/x86_64/zabbix-release-4.0-1.el7.noarch.rpm
[root@tomcat ~]# yum install -y zabbix-agent
[root@tomcat ~]# grep "Server=" /etc/zabbix/zabbix_agentd.conf
#    Example: Server=127.0.0.1,192.168.1.0/24,::1,2001:db8::/32,zabbix.example.com
# Server=
Server=172.16.1.71
[root@tomcat ~]# systemctl start zabbix-agent.service
8. zabbix添加tomcat主机,并添加Zabbix自带java监控模板